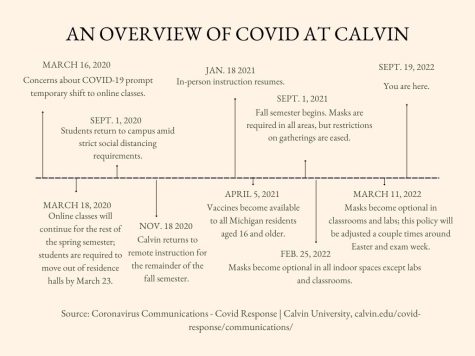


Hidden Incidence: Calvin’s dashboard doesn’t follow standard epidemiological practices
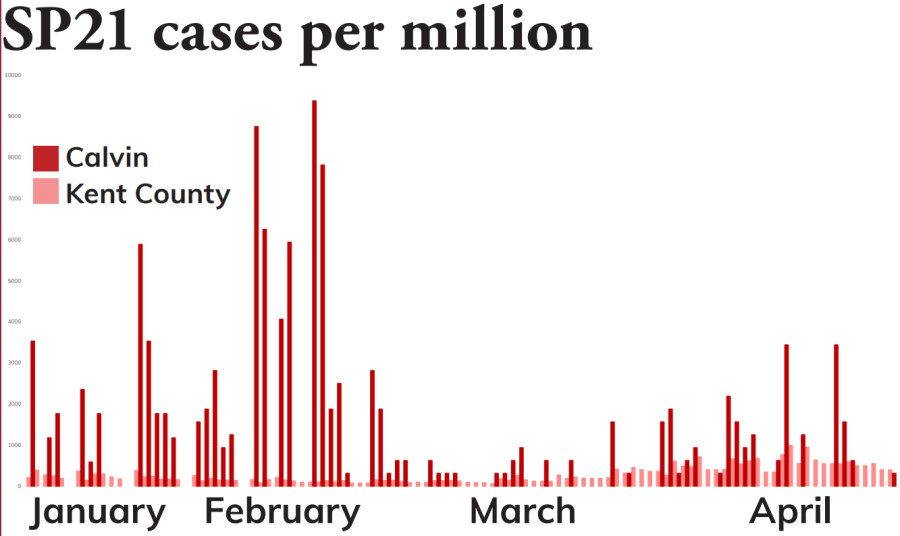
Throughout the past year, Calvin’s COVID-19 caseload rate has frequently been two times higher than that of Kent County. Calvin has also carried higher caseloads than other colleges in Kent County and Michigan.
According to data obtained from Calvin’s dashboard, when adjusted for Calvin’s population, Calvin’s caseload reached its highest point in February 2021, at 4,150 new cases per million. In comparison, Kent County had 100-150 new cases per million during the same period.
Calvin’s COVID-19 dashboard does not show standard epidemiological data. The dashboard only reports the number of active cases each day.
“Usually in epidemiology we count case rates,” said biology and public health professor Erica Boldenow, who runs Calvin’s dashboard. “It’s information about the number of cases per population over a particular time that matters most for preventing disease transmission.”
Boldenow also noted that, although this method has its own challenges — it’s notoriously difficult to estimate the size of a population — it more accurately represents the spread of a disease.
When Calvin’s COVID-19 cases are adjusted for a population of 3,200, an estimation of on-campus and off-campus students using the Fall 2020 Day 10 report, the university’s case rates for the 2020-21 school year are significantly higher than the surrounding community. They’re also higher than rates at Aquinas College, Grand Valley State University and the University of Michigan in weekly averages of cases, according to the dashboards available on those institutions’ websites, as well as that of the Kent County Health Department.
Boldenow noted that the dashboard was designed in order to meet the needs of the general public.
“We made the dashboard to have information that people wanted,” Boldenow said. Most people are not aware of how to read and interpret standard epidemiological data, so the dashboard was designed to only show how many new active cases were present each day.
“Even though it’s standard practice in epidemiology to report case numbers per population, it’s always challenging to do so,” Boldenow said. One challenge is estimating the size of a population. At Calvin, for example, Boldenow said that the student body size changes during the semester. It’s also difficult to account for part-time students, graduate students and dual-enrolled students.
“Per population data would ultimately be an estimate anyway,” Boldenow said.
In addition, standardized epidemiological data takes time to produce.
“It is standard practice to count the number of new cases per day, but those are always backdated to symptom onset,” Boldenow said. Given the time it can take to get a COVID-19 test and receive results, it can take a week or more after symptom onset for an individual to have their data recorded.
“It gets confusing for the average person to use a dashboard like that. It can take up to two weeks for the data to stabilize,” Boldenow said. Calvin’s reporting method eliminates this delay by simply recording the number of active cases each day.
The problem with only reporting active cases, however, is that it is harder to understand the rate at which the virus is spreading. Epidemiologists look to see if a disease is spreading exponentially, because it’s much harder to stop a disease from spreading when it reaches or exceeds the exponential section of its growth curve.
During late October and early November 2020, Calvin’s COVID-19 case rates per population grew faster than exponentially. Calvin, however, did not take action until the state of Michigan required that colleges cease to have classes in person, which occurred a week before Calvin’s planned Thanksgiving break.
Recording only the active number of cases per day — instead of the standardized, per population data — also may have led the Calvin community to underestimate the virus’ spread in January 2021. During interim, the university’s caseload may have appeared low, averaging between 20 and 35 active cases per day. Yet in January, there were only about half the number of students taking classes on campus. Thus the case rates were actually much higher than they appeared and a factor of 100 higher than Kent County. This data demonstrates that the exponential growth seen later in the semester likely began in January.
Despite the challenges of providing accurate, accessible information about Calvin’s COVID-19 caseload to the general public, Calvin has managed to keep a steady, lower number of cases throughout the 2021 fall semester. According to Boldenow and the dashboard, Calvin’s case numbers have averaged between two and 10 new cases per week.
“Numbers aren’t super great, but they’re steady,” Boldenow said. “We don’t see any exponential increases.”
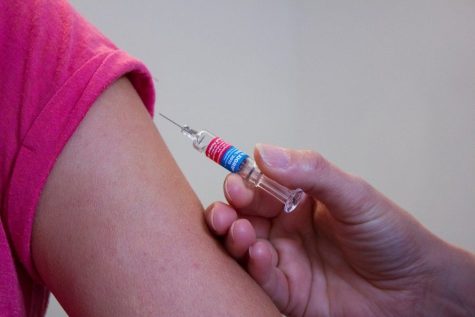
Vice President for Student Life Sarah Visser noted that, at this point in the semester, “approximately 85 percent of our students are vaccinated or planning to be vaccinated. As this number continues to increase, we believe our campus community is further protected against the spread of COVID-19.”