What would a typical day on campus look like if campus was open?
With school closures, stay-at-home orders, and states and the media encouraging social distancing, I decided to display the importance of social distancing and uncover the reasons why schools and other large gatherings have been canceled.
I used The Center for Social Research’s (CSR) Tableau meeting risk calculator that tracks the spread of COVID-19 to see how likely it would be for me to get exposed to COVID-19 on a normal Thursday of classes.
A YouTube video by Neil Carlson, director of CSR, explains how the meeting risk calculator works. The Tableau meeting risk calculator takes the population of the county, deaths reported in that county, fatality rate of the virus, and spread rate of COVID-19 in order to predict the likelihood of someone having the virus showing up to meetings of different sizes. The meeting population is taken as a random sample of the county population. According to Carlson in the video, the calculator gives “an informed estimate of what the fatality rate is given infection, including all the infections that are never tested or become severe enough to come into a hospital.”
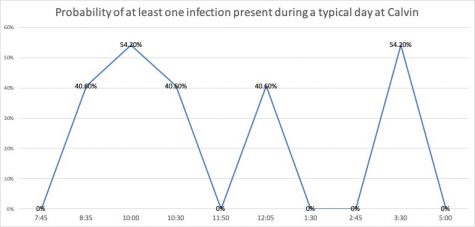
On the day I did this, a typical Thursday at Calvin, I would have come into very close contact with at least 130 people. This is in the unacceptable risk zone, and there would have been at least a 92.6% probability of at least one infection I would have come in contact with by the end of my day.
This does not include the people I would have crossed on the path, in Johnny’s, in the hallways, or during other small stops I would make throughout the day.
This outline of a typical day reveals the importance of social distancing and not meeting in groups of larger than 10 people.
My Thursday schedule:
7:45 — Breakfast at home
8:35 — PSYC 399
10:00 — study and coffee in the library
10:30 — SOC 305
11:50 — Quick snack in Spoelhof cafe
12:05 — Ballet 2
1:30 — SOC 395
2:45 — Lunch in Uppercrust
3:30 — Homework in the library
5:00 — home for dinner and studying


