


Enrollment drop more serious than comparable schools, student body demographics remain consistent
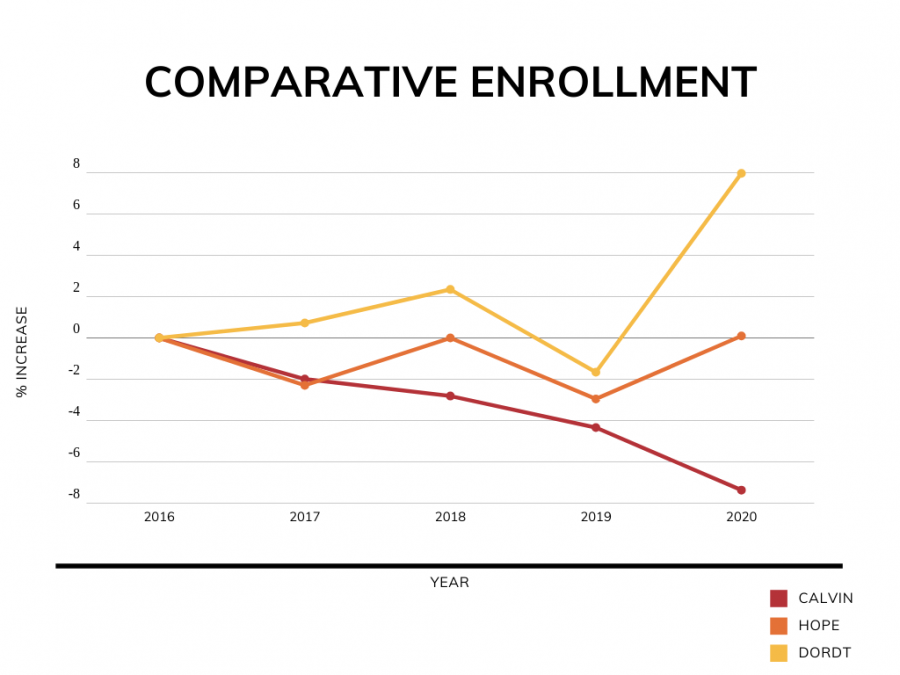
Comparison between Calvin, Dordt, and Hope’s enrollment over several years.
Calvin’s total enrollment dropped to 3,307 students for the 2020-21 school year, a decrease of 7.3% (263 students) from the previous year, according to annual enrollment census data.
It’s been a difficult year for institutions across the country, but questions linger about how much of the decrease is attributable to COVID-19.
“It’s hard for us to actually sort out what in this enrollment number is COVID-related and what’s structural and what’s in our own performance,” said University President Michael Le Roy in a video town hall Sept. 16.
Calvin’s total enrollment has not increased since 2013, when total numbers stood at 4,034 students.
Le Roy continued to say that enrollment numbers are one of the university’s top priorities and a problem he plans to invest significant time and focus to this year.
“This is not where we wanted to be, and we are not satisfied,” the president stated.
Le Roy and Vice President for Enrollment Strategy Lauren Jensen did not immediately respond to Chimes’ requests for comment on enrollment numbers and strategy.
For comparison, Hope College, Calvin’s rival in Holland, Michigan, reported a total enrollment of 3,060 this school year, up three students from the previous year. This was the first total enrollment increase at Hope in the past five years.
Dordt University in Iowa had their best year on record for enrollment this year, reporting a total of 1,666 compared to last year’s 1,548.
Of the 3,307 enrolled at Calvin, 3,157 are full-time equivalent, 2,964 full-time traditional undergraduates. The incoming class is made up of 805 students, 644 of whom are traditional first-year students.
Although the decrease was significant, census data showed few significant changes in demographic and geographic percentages, meaning the makeup of the student body is still largely the same.
Notable changes include a one percentage point increase in white students and a 0.6 percentage point decrease in students without a stated or known ethnicity. All other ethnicities saw increases or decreases of 0.3 or less percentage points.
The largest changes in religious affiliation were a decrease in CRC students by 0.6 percentage points, a 0.7 percentage point increase in students affiliated with other Reformed traditions, an increase in Roman Catholic students by 0.5 percentage points, and a decrease in students with no religious affiliation by the same.
The most significant changes were seen not in religious affiliations or race or nationalities but in the types of students enrolled. Undergraduate enrollment fell by 284 students, an 8.7% decrease, but the graduate population grew by 23 students, a 22.3% increase from last year.


Adam • Aug 18, 2021 at 7:51 am
I graduated from Calvin in 2013, yet I will not send my kids here. Too expensive an education for the social indoctrination garbage they tried to brainwash me with. They need to return to their roots.
Wilbur Smit • Nov 28, 2020 at 12:57 pm
Just watch the BLM video produced by Calvin faculty and staff to get a sense of the pathetic white guilt and self-loathing that has infested a formerly solid academic institution. Critical race theory now dominates the humanities and social sciences, and is making inroads into the hard sciences and even business and engineering. Parents of prospective students likely don’t want to spend hundreds of thousands of dollars to have their children indoctrinated into a neo-Marxist worldview by professors who are supposedly “committed Christians”. People are voting with their feet, and Calvin is in the process of discovering the truth in the statement “get woke, go broke”.
Marty Wondaal • Oct 2, 2020 at 7:41 am
This is an alarming drop in students.
According to many Calvin employees, the school has two problems: it is inherently racist and many, many students get sexually assaulted. Neither one of these issues looks good on a brochure, especially when it costs over $100,000 for parents to send their children there.
Or maybe it’s something else. Maybe it’s not a systemically racist place, and, if your child is careful and responsible, he won’t get sexually assaulted. Maybe the real problem is the worldview of so many employees, which is at odds with the families that would consider Calvin University.