Freshman enrollment sees first growth in eight years
Highlights from the university's census data
September 12, 2021
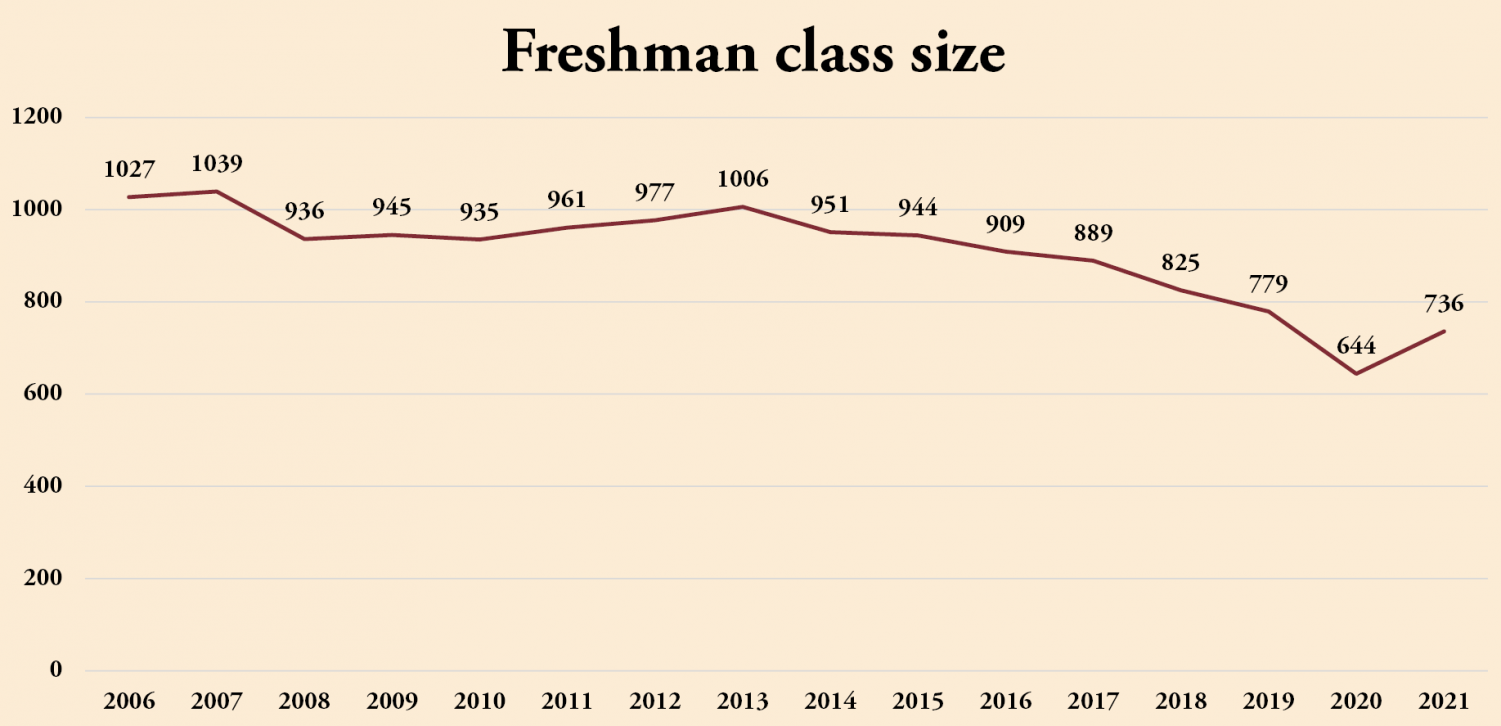
This year’s freshman class is approximately 14.3 percent larger than the year previous, according to new data released by the university this week. For these students, it’s their first time in any college, or FTIAC. For Calvin, it’s the end of an eight-year decline in FTIAC enrollment.
Data also showed noteworthy changes in demographic trends and denominational affiliations.

This fall, the university welcomed 736 freshmen into the class of 2025. This follows a change in admissions strategy due to decreasing enrollment. Last year’s FTIACs numbered 644, the lowest on record since Calvin began releasing such data online in 1997.
“We are thrilled that Calvin exceeded its aggressive enrollment growth goal this year,” Vice President for Enrollment Strategy Lauren Jensen told Chimes. “… Our enrollment strategy division worked tirelessly, and I’m so grateful for our team’s innovative and collaborative work throughout an incredibly unique recruitment year. Thank you to all our faculty, staff and students who helped make that possible.”
The department initially set out to recruit 725 freshmen, exceeding its own goal by 11 students.
In addition to the class of 2025, Calvin also welcomed 49 transfer students and 200 other new students in graduate programs, the Ready for Life Academy, the Calvin Prison Initiative, and more, Jensen said.
The number of new students at Calvin totaled 983, a 22 percent increase from last year’s 805 incoming students.
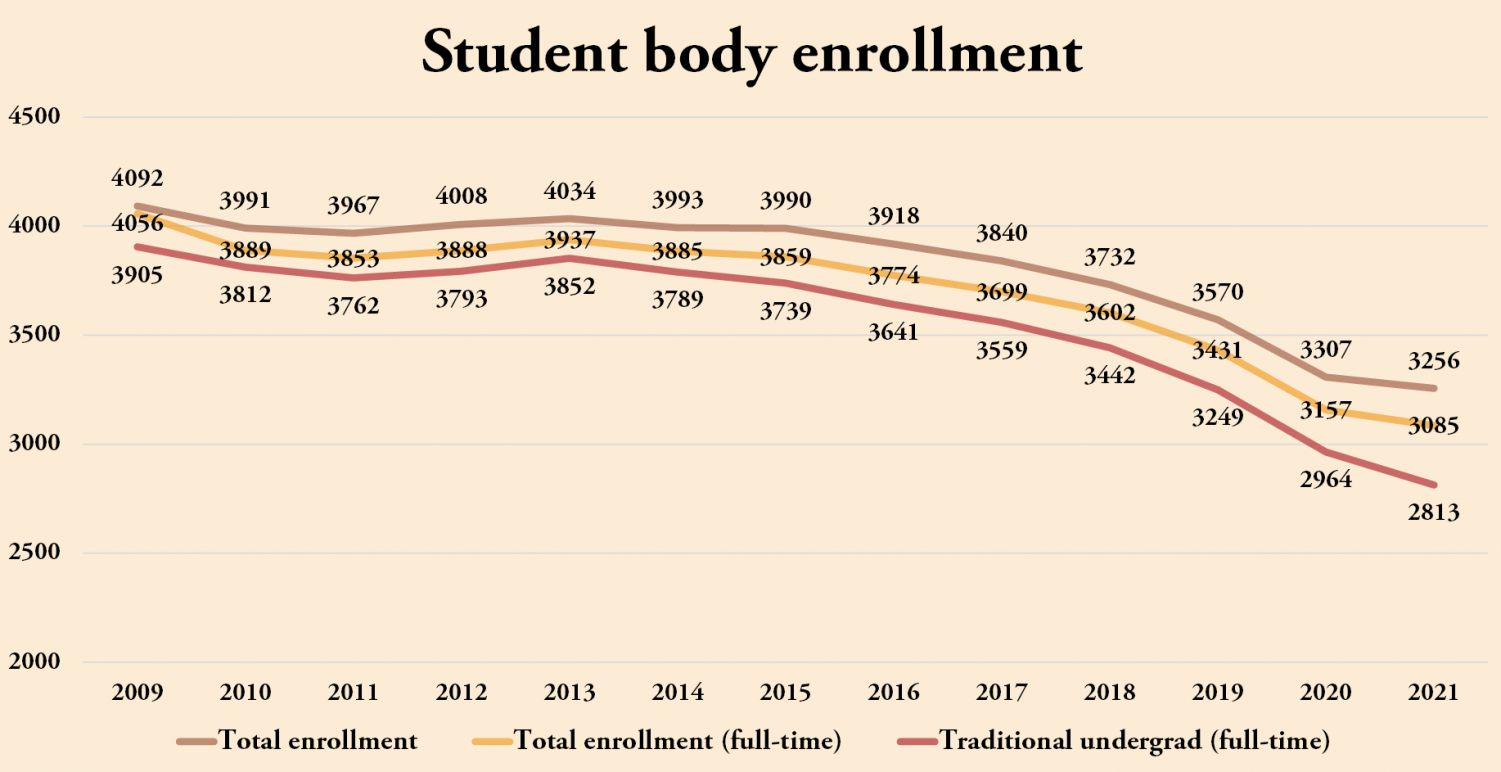
Though new numbers look promising, the university’s total undergraduate enrollment still decreased this year from 3,181 to 3,068, due to the smaller-than-average sizes of the sophomore, junior and senior classes.

A sustained growth rate of 983 new students per year would see Calvin at a hypothetical total enrollment of 3,932 students by the fall of 2024, numbers the university hasn’t seen since 2016.
Race, ethnicity and geography
Enrollment data is publicly available in the Office of Enrollment Research’s Day 10 reports, which, in addition to a headcount, include information about student demographics and majors.
Most changes observed in the data were incremental when viewing statistics about the whole student body, but when stratified by class level, it’s clear that this year’s freshman class has some remarkable differences from previous classes.
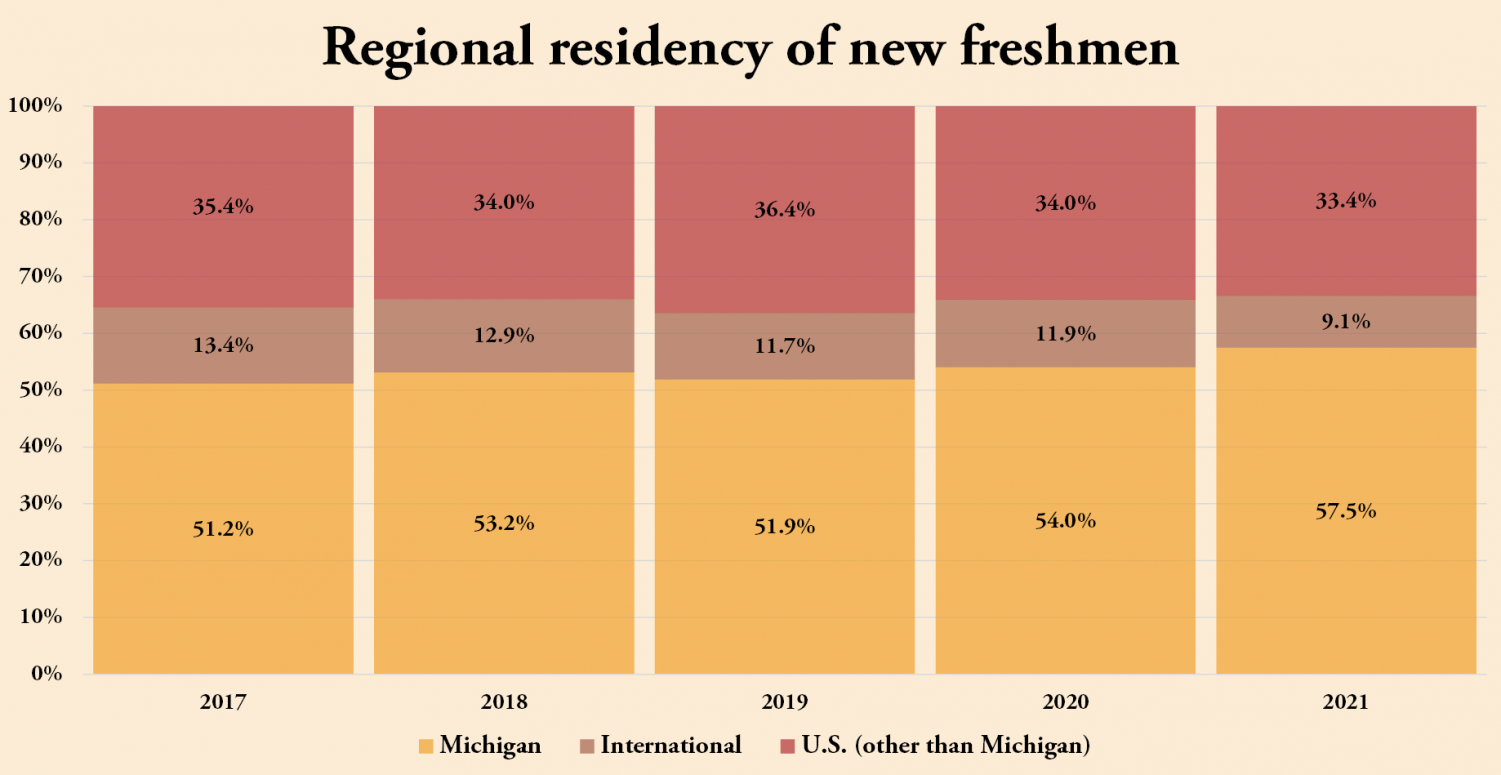
The number of FTIAC students from Michigan increased 3.5 percentage points over last year’s class. The numbers of students from the Eastern and Southern U.S. also increased by 1.3 and 1 percentage points respectively.

The number of international FTIAC students decreased 3.9 percentage points between the class of 2024 and the class of 2025.
At 77.6 percent, the class of 2025 also has a higher percentage of white students than any class in more than five years.
Meanwhile, there were marked decreases in the percent of Hispanic/Latino and non-resident alien FTIACs on campus this year.
Jensen was not immediately able to comment on whether the noticeable shifts in geography, race and ethnicity were the results of Calvin’s new admissions strategy.
Affiliations and majors
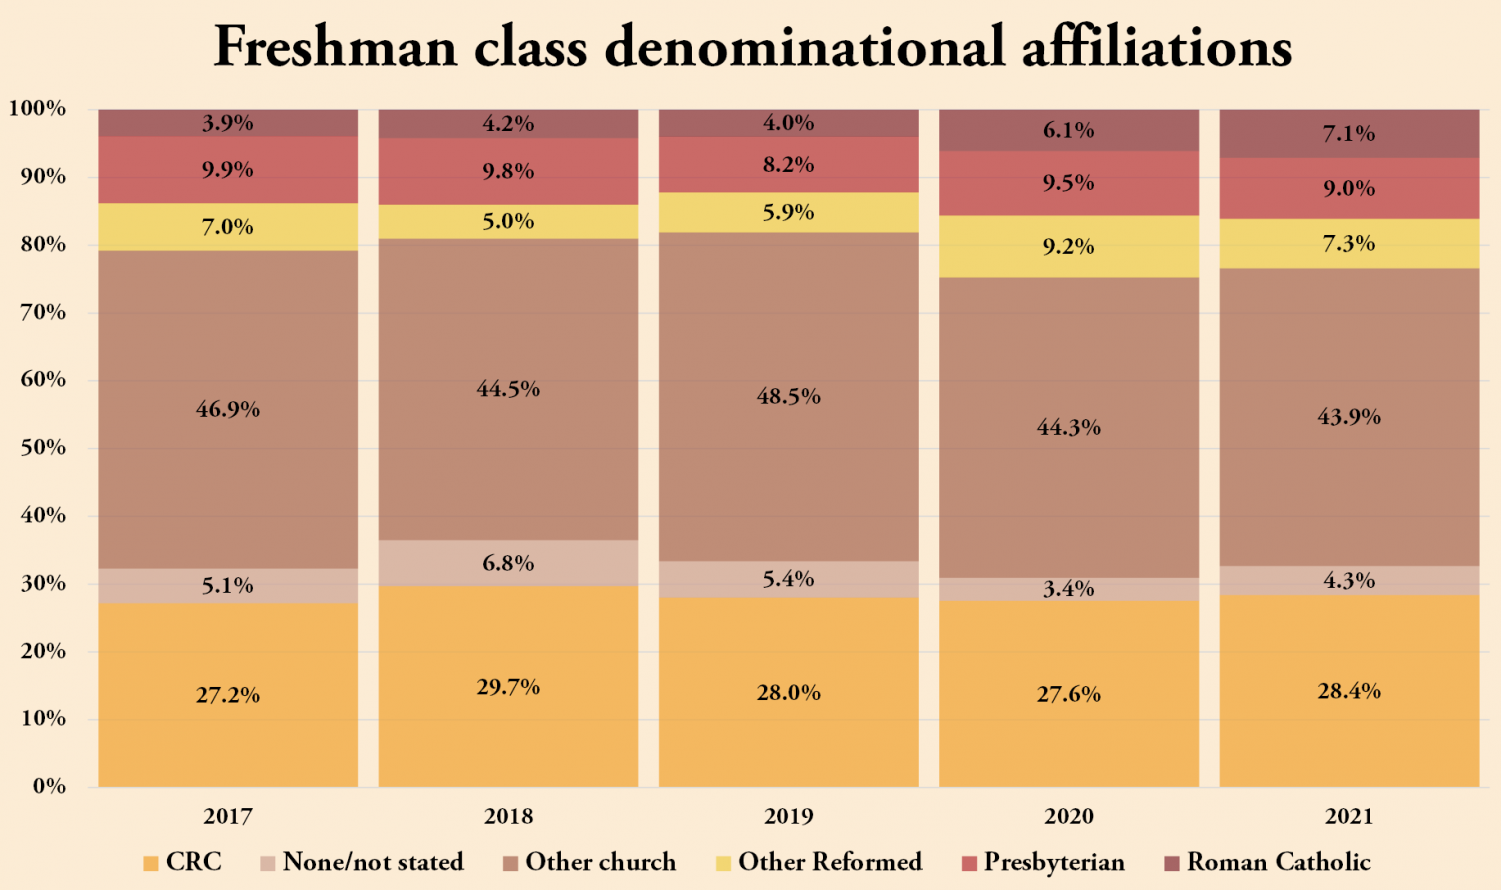
The percentage of Christian Reformed students remained relatively consistent with numbers from the past five years, despite significant declines of CRC Calvin students in recent history.
This year’s freshman class includes 52 Roman Catholic students, an increase of one percentage point over last year and the largest proportion of Roman Catholic FTIACs in at least the past ten years.

The class of 2025 also has the highest number of non-alumni children in at least five years, with only 31.4 percent of students coming from a household where at least one parent attended Calvin.
Decreases in alumni children and students from other Reformed denominations suggest a noteworthy shift from Calvin’s traditional audience towards new populations.
The number of graduate students at Calvin this fall also shows a notable increase over years past. The Day 10 report boasts 89 total grad students, 75 of whom are full-time equivalent. Last year’s graduate students numbered 41 in the fall, with 34 FTEs.
The only academic programs to see increases from last year in the number of majors were philosophy, kinesiology, engineering and congregational and ministry studies.
Many programs, however, did not experience proportional decreases and only experienced losses in total numbers of majors due to declining overall enrollment.
More information on the university’s demographics and the full dataset are available on the Office of Enrollment Research’s website.